RIGOL MSO5000 Live Monitor (Hacked FW Compatible)

  • 3.2K Views
  • Last Post 27 August 2025
baerndorfer posted this 12 July 2025

Hi all,

because i was not very satisfied with Web-View from Rigol for my MSO5000 i build my own one.

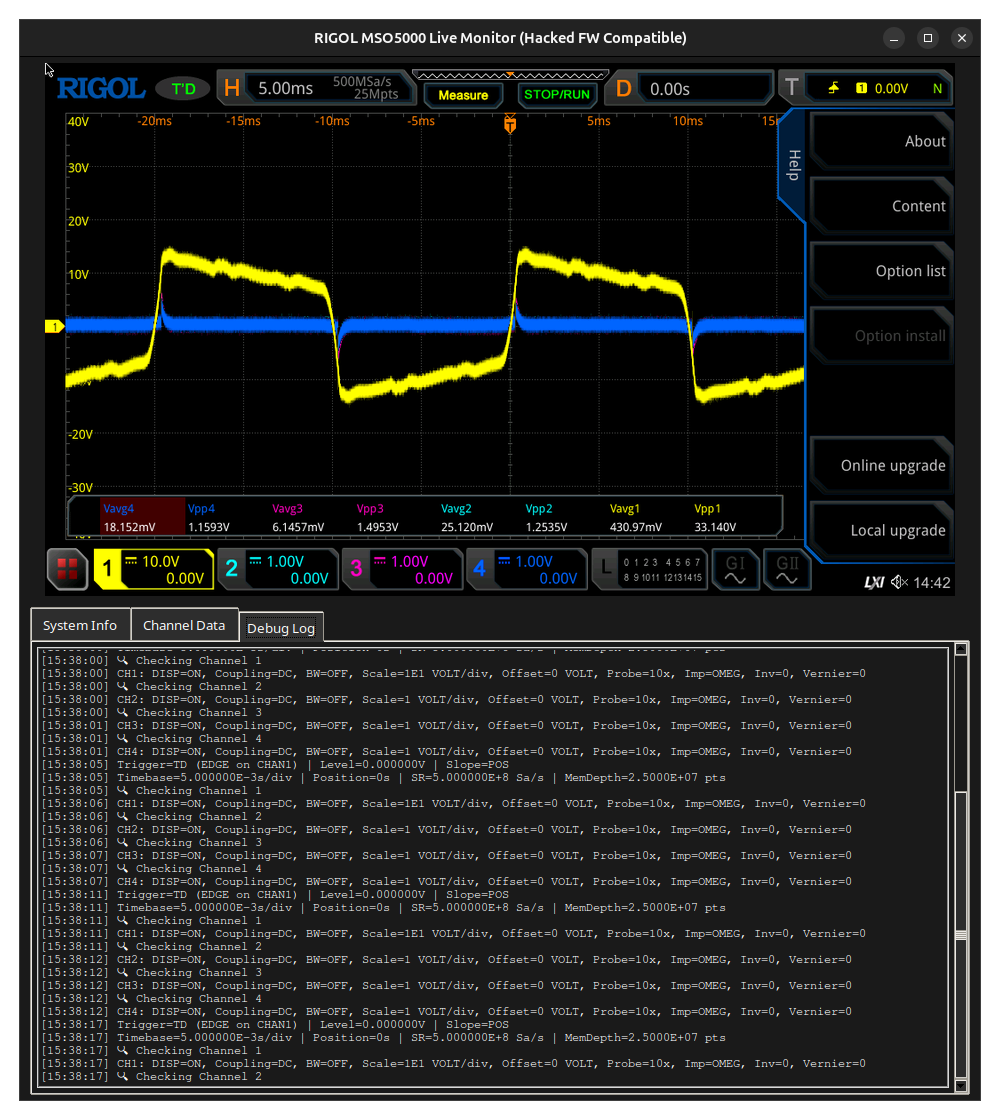
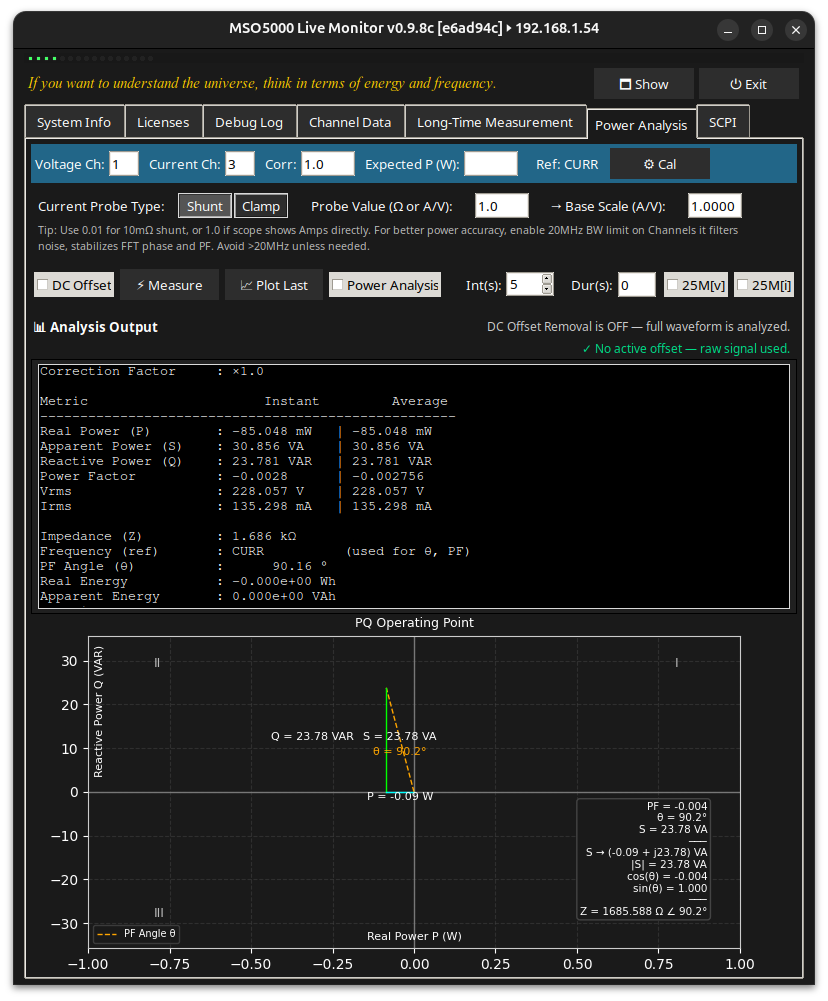
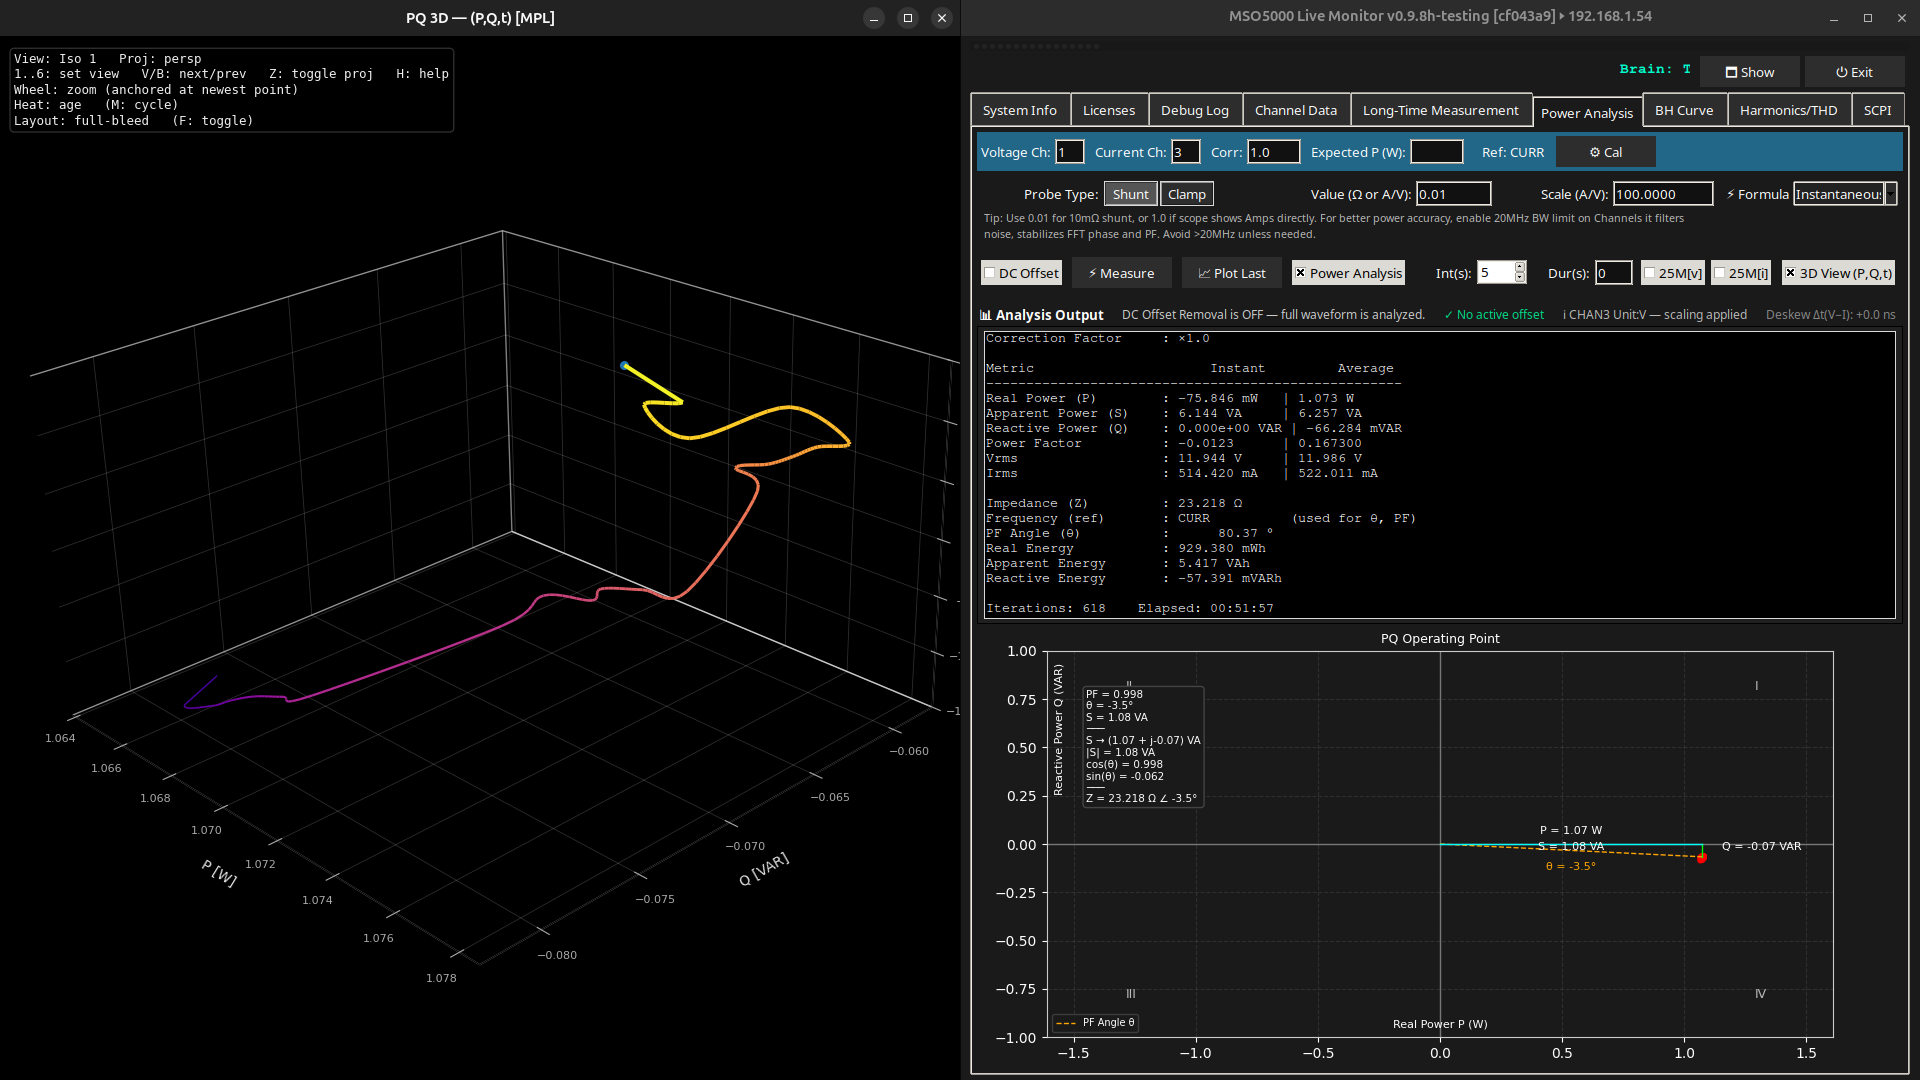
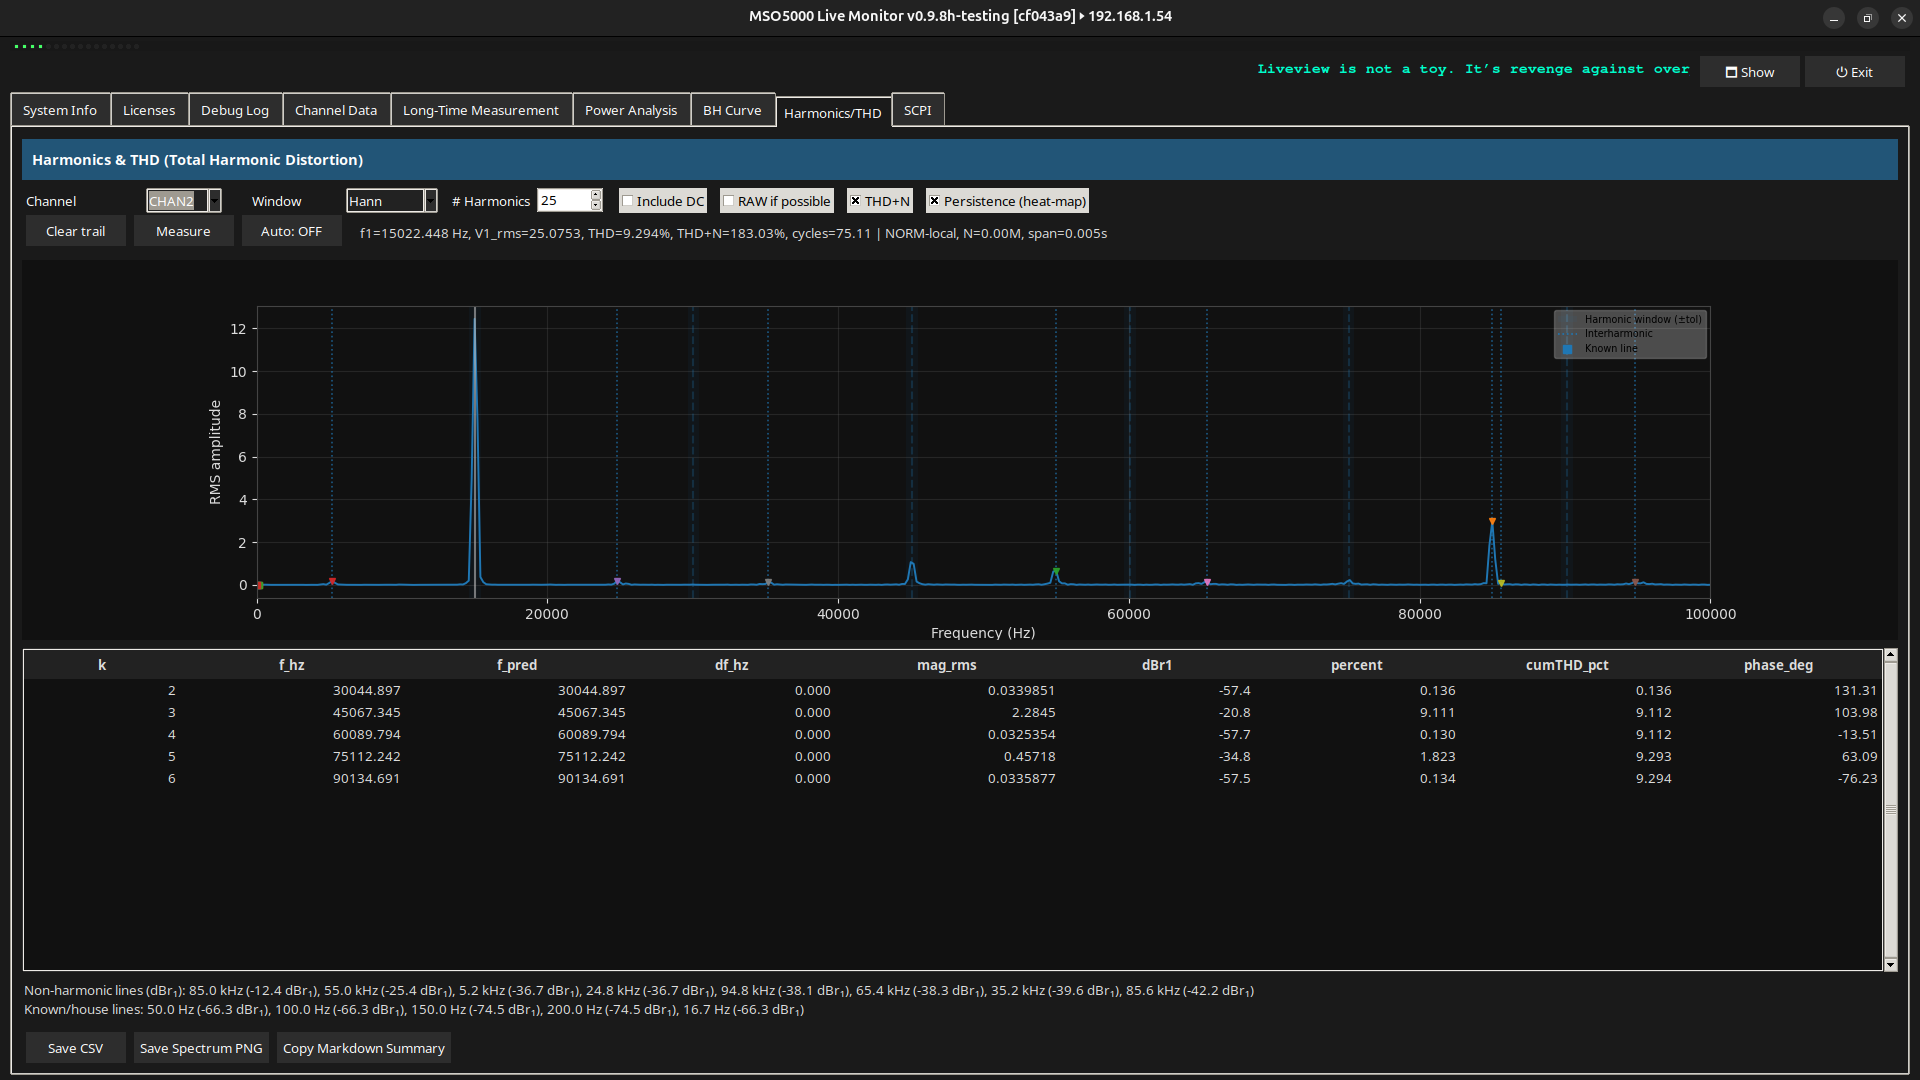
This tool provides a live view and SCPI-based data extraction from a **Rigol MSO5000** oscilloscope with **hacked firmware** via VNC and VISA (SCPI) interfaces.

The script displays:
- Live screenshots from the oscilloscope (via VNC)
- Channel information including coupling, bandwidth, scale, offset, and probe settings
- Trigger and timebase settings
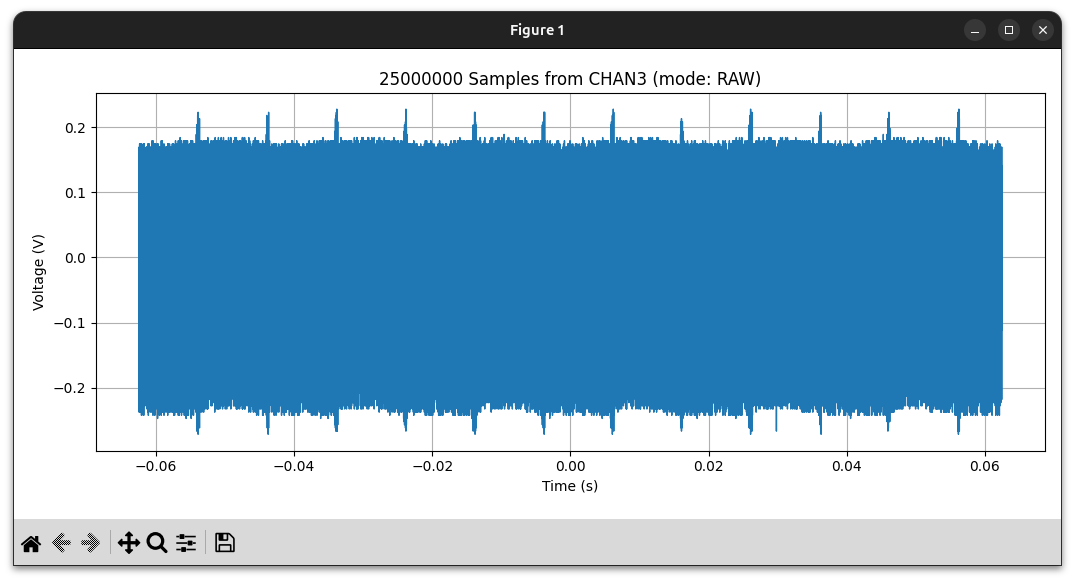
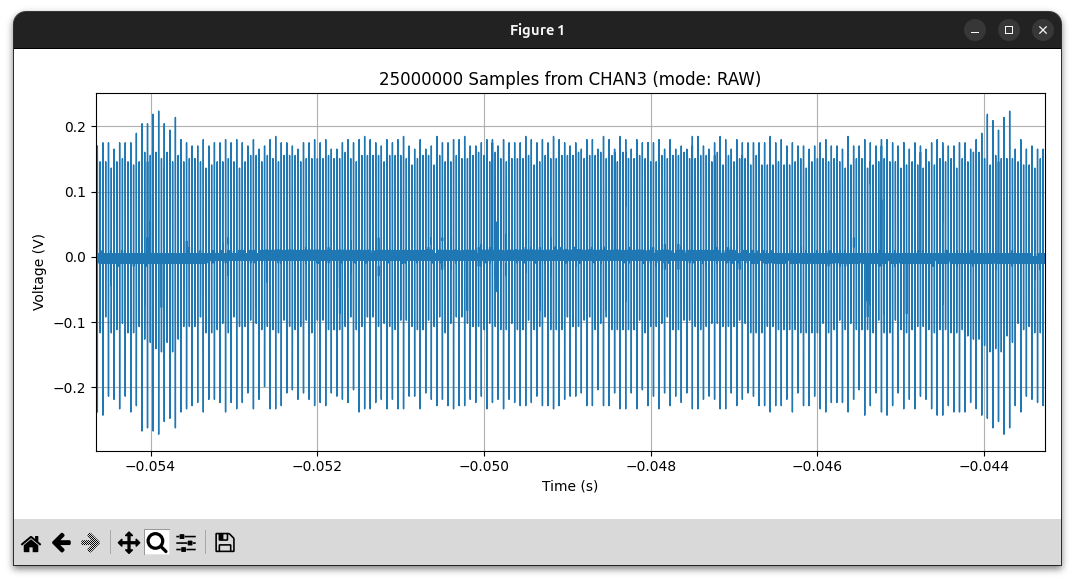
- Raw waveform statistics (Vpp, Vavg, Vrms) for up to 4 channels
- A scrollable debug log for diagnostics

## Requirements

This script is written in Python 3 and depends on the following libraries:

| Library    | Purpose                            |
|------------|------------------------------------|
| `tkinter`  | GUI interface                      |
| `Pillow`   | Image processing for screenshots   |
| `numpy`    | Numerical processing of waveforms  |
| `pyvisa`   | SCPI communication over TCP/IP     |
| `vncdo`    | VNC client to capture screen image |

### Install dependencies

Make sure you have Python 3 installed, then:

```bash
sudo apt install python3-tk python3-pip
pip3 install pillow numpy pyvisa
sudo apt install vncdo
```

> Note: On Debian/Ubuntu systems, `vncdo` is often available as a package. If not, install it via `pip install vncdo`.

##How to Use

```bash
python3 rigol_vnc_liveview4.py
```

You will be prompted in the terminal to enter the IP address of your RIGOL MSO5000.

Make sure:
- The oscilloscope is on the same network.
- VNC is enabled on the oscilloscope.
- The oscilloscope responds to SCPI commands over TCP/IP.

##Hacked Firmware Notice

This script is optimized to **avoid crashing or hanging** when used with unofficial / hacked firmware:
- Timeouts are reduced
- Some known problematic SCPI queries are skipped or blacklisted after failure

##Screenshot Path

By default, screenshots are saved temporarily at:
```
/tmp/oszi_screenshot.png
```

##Customization

You can adjust these in the script:
- `INTERVALL_BILD`: How often to update the screenshot (seconds)
- `INTERVALL_SCPI`: How often to fetch SCPI data (seconds)
- `WAV_POINTS`: Number of waveform points to request per channel

##License

This project is for **personal use only**. Use at your own risk. Not affiliated with Rigol Technologies.

Attached Files

baerndorfer posted this 01 August 2025

so it turns out i can get 1000 samples or 20Mio from scope. nothing between  
in most cases 1000 is ok but if the signal look like white-noise we need more data to get accurate results. there is a testing branch where you can find the mostly unstable versions.
so far it looks good. the GUI gets a bit heavy i think.

still many things to fix...
regards

B

baerndorfer posted this 01 August 2025

inside the folder /utils i have placed waveform_extractor.py
when you execute it we can see how the scope react to our command.

python3 utils/waveform_extractor.py 192.168.1.54 --channel 3 --mode RAW --stop --save
[17:13:50] ๐Ÿ”Ž VISA resources: ('TCPIP::192.168.1.54::INSTR',)
[17:13:50] ๐Ÿ”Œ Trying to connect to: TCPIP0::192.168.1.54::INSTR
[17:13:50] โœ… Connected: RIGOL TECHNOLOGIES,MSO5074,MS5A233905324,00.01.03.03.00

๐Ÿ“ก Connected. Fetching 1000 samples from CHAN3...
๐Ÿ›‘ Acquisition stopped for waveform readout
๐Ÿ”ง Using point mode: RAW
๐Ÿ“Š Sample Rate: 2.000000E+8 Sa/s — Memory Depth: 2.5000E+07 pts
โณ Downloading waveform data...
โœ… Received full 25000000 samples from scope.
๐Ÿ–ผ๏ธ  Saved plot as CHAN3_25000000pts_RAW_20250801_171404.png
โ–ถ๏ธ Acquisition resumed.

script will bring up a plot that you can see the waveform.

we can zoom in of course...

regards

B

baerndorfer posted this 03 August 2025

I added 2 documents where i show how i do the measurement for DC-system and AC.

For Shunt-Based DC Power Measurements (Low-Side Current Sensing)

For Grid Power Measurement with Differential Current Probe (High-Voltage AC)

have a nice day

B

baerndorfer posted this 05 August 2025

just found out, that there is a wonderful framework named MkDocs which helps a lot with any sort of documentation. Since i do a lot of markdown.files this comes pretty handy.

i use it now for my liveview project.

baerndorfer posted this 07 August 2025

because it is of interest (i think) we can now look at the B-H curve of our cores.

in 'auto' mode we can watch how core reaction is. and there are lots of magnetic data that we can use for further processing.

this new feature is not bug-free

and maybe the explanation not 100%.

regards

B

AlteredUnity posted this 08 August 2025

Great job, very quickly. I only plotted data after capturing and running a python script with CSV file, or had script stop the scope and measure whole consecutive 1/2 periods at a time, then do piecewise integration over that.

But it kinda looks like your getting somewhat the same measurements issues I ran into when I was trying to use data from scope. Because the scope has repeat measurements/times, i had to strip those, find zero_crossings(there are so many repeats, or little noise that will make the script think its part of an Ton or Toff), etc. I finally got my little script working measurement wise, reporting correct, though couldn't get it to graph, much less do it live like you have.

It may be easier to use a math channel for the integration. This was the main reason I asked about importing Math channel. Though, the measurements appearing may just be from other things you have going on in the circuit, which would need to be measured and/or subtracted from the primary(or coil your measuring).

You are making this scope so much more amazing, thank you.

baerndorfer posted this 08 August 2025

script will accept math channels on both input fields. the thing is, that a meaningful bh-curve should be done with using sinusoidal shapes. then the whole math behind will bring out what we can expect. when we change to pulsed systems with oszillating currents the situation changed completely. we have to deal with bias on our probes or timing differences and such. i'm still not sure how to deal with this. goal is to have a solid bh-curve which represents reality as much as possible.

still many things to learn...

regards

B

Jagau posted this 12 August 2025

Hi Bearndorfer

you wrote,

i'm still not sure how to deal with this


As I don't know much about programming but perhaps this excellent site, which I consult often, on the measurement of magnetic hysteresis will give you some good ideas.

https://meettechniek.info/passive/magnetic-hysteresis.html

Jagau


baerndorfer posted this 13 August 2025

brillant page and yes i know this site very well

we do practically the same in software. the main differences are practical. we assume equal turns for drive/sense, we digitally remove voltage DC instead of hardware blocking. and we currently report loop-area/μแตฃ metrics rather than converting to watts per core.

have a nice day!

B

baerndorfer posted this 18 August 2025

watching pq-plots all day long can get kind of boring sometimes. so i added a 3d-view where i can watch the pq over time as 3d spline. just for fun...

in another tab we can calculate harmonics and THD which seems to be interesting.

it shows pulse frequency, the resulting harmonics and other frequencies, that stand out. 

still many things to learn

regards

B

Close